Paid Search and Display Advertising in the Travel Category: American Airlines’ Spend Takes Off
-
Q1 2013 Ad Trends Infographic

See how Hispanic media spend is on the rise. Get our 2013 Q1 U.S. ad spend infographic:
QSR Ad Insights Report

Concerns about obesity and health are shaping advertising strategies for Quick Services Restaurants – an industry that spends billions on media every year. Learn how the leading players are responding to this new environment in our complimentary QSR Ad Insights Report.
-
Paid Search and Display Advertising in the Travel Category: American Airlines’ Spend Takes Off
Insight Center
What creates inspiration? At Kantar Media, we think passionate experts, sound methodology and pertinent analytics help inspire our clients to make creative business decisions everyday. By transforming data into insights, we provide even more opportunities for success.
Paid Search and Display Advertising in the Travel Category: American Airlines’ Spend Takes OffAs the summer vacation season has come to a close, it’s the perfect time to take a deep dive on digital ad spend in the travel category. Following up on our June insights brief, Paid Search Strategies in the Travel Category, Kantar Media took a broader look at the category over a six-month period and performed an in-depth analysis of the leading travel segments and advertisers. Despite a struggling economy, total ad spend is up by 10% from last year in the travel category. A media breakdown reveals that paid search and display advertisements dominate the category as advertisers direct ad budgets away from traditional media and into the Internet, focusing primarily on paid search investments.
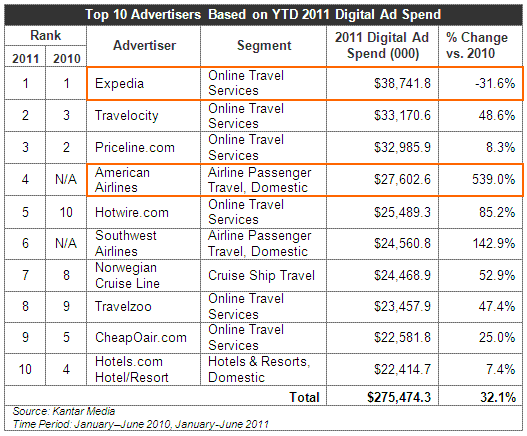
An analysis of the top ten digital advertisers in the travel category during the first two quarters of 2011 shows a total investment level of $275.5 million and an increase by almost one-third compared to a year ago. While six out of ten of these top advertisers are online travel services, an airline advertiser stands out as having the highest increased spending as compared to last year – American Airlines, with a 539% increase in digital ad spend compared to that of 2010. American Airlines’ spend increase is directly related to the removal of its flights from Orbitz in December 2010 and Expedia’s subsequent removal of American Airlines flight listings from its website back in January 2011, after both companies failed to reach an agreement at the expiration of their 2010 contract.
To compensate for its disappearance on both Orbitz and Expedia websites, American significantly increased its spend in digital advertising. By increasing display ad spend by 605% and paid search by 492% from the previous year, the airline company fought to boost site traffic despite its absence on two leading travel reservation sites. American had its biggest jump in ad spend in February — right after it started feeling the effects of the Expedia disagreement. On page five of this analysis, we take a closer look at AA’s top search keywords, display investments, and creative strategy to understand why and how the advertiser radically increased its digital spending. But first, we examine the travel category as a whole.
Measured Ad Spending by Segment
The highest spending travel segment across all media, domestic hotels and resorts, led the category with $752 million in ad spend, with a 0.5% decrease from 2010. Online travel services and domestic tourism promotion segments followed closely behind; both increased their spend by 9% over last year. What’s most striking is the 44% increase in the domestic airline passenger travel category, which may be explained by American’s and Southwest’s substantial 2011 expenditure; the two airlines combined dominated the domestic airline category, responsible for 57% of the top 10 advertisers’ expenditure.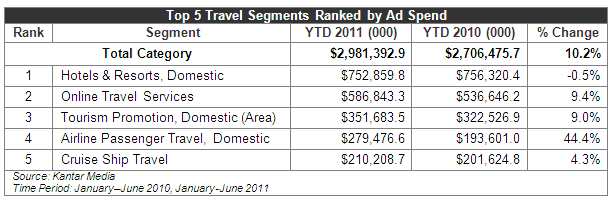
Measured Ad Spending by Media
In terms of ad spend share by media, Internet emerges as the key vehicle in the travel sector’s ad strategy, dominating almost 40% of the budget for the January-June 2011 period, an increase from its 2010 share of 36%. Paid search and online display spend accounted for 15% and 24% of total spend respectively, each with an increased share as compared to one year ago. All other media experienced a decrease in share as the proportion of ad budget allocated to Internet advertising increased, with travel companies redirecting more and more ad dollars into search and display categories.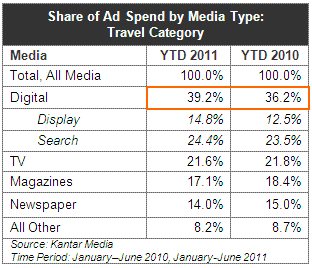
Digital Share by Segment
The top five travel segments varied widely in their digital share of total ad spend. For example, only about 21% of the domestic tourism promotion segment’s ad costs were in digital, with the majority of their digital dollars spent on display ads. The domestic hotels and resorts segment spent one-fourth of total ad budget in Internet ads, and distributed more than half of this digital budget to paid search. On the other side of the spectrum, the online travel services segment advertised heavily on the Internet, spending over three-fourths of its ad dollars in digital ads. These online booking agencies focused mostly on paid search, allotting 67% of their budget to paid search and 11% to display ads.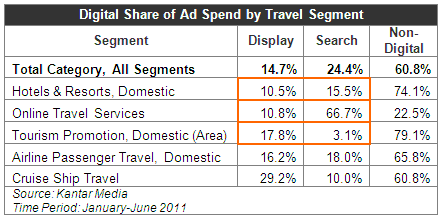
We were interested to see if this emphasis on digital advertising held true for each of the segment’s top advertisers. A closer look at the online travel service segment reveals that nine out of ten of the top advertisers allocate a majority of budget to digital. That said, there is a visible range in the distribution of digital and non-digital ad dollars. CheapOair.com, OneTravel.com, and Booking.com do virtually all of their advertising online. Orbitz, on the other hand, spends 59% of its ad budget in non-digital media, inconsistent with the segment’s overall trend.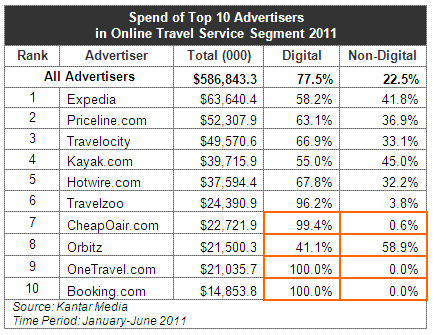
Measured Ad Spend by Travel Advertisers: Who’s Up, Who’s DownThroughout the first half of 2011, Expedia, Travelocity and Priceline remained in the top three rankings for highest Internet advertisers. American Airlines and Southwest Airlines emerged as new members of the top ten group in 2011, jumping to number four and six respectively.
All of the top ten Internet travel advertisers, except for Expedia, increased their digital budget between 2010 and 2011. Expedia’s digital ad spend decreased by almost one-third. In glaring contrast, American Airlines increased its online expenditure by a whopping 539%, with a jump from $4.3 million in the 2010 January-June period to $27.6 million during the same period for 2011. This increase propelled AA’s rise to the number four slot of top Internet advertisers in the travel category, with considerable increases in both search and display ad spend. Such an aggressive ad investment raises the question -- how did American Airlines distribute these dollars across online media?
Close-up on American Airlines: Monthly Digital Ad Spend
If we look at American Airline’s 2011 digital ad spend on a monthly basis, we see a spike in spend of 182% in January alone, when AA increased its spend from $1.9 million to $5.3 million. And again, between March and April, its spend rose 82% from $5 million to $9.1 million. Such extreme jumps are uncharacteristic of the 2010 American Airlines, which kept its ad spend at a relatively fixed amount under $1 million, with little variation month-to-month. We used Kantar Media Compete’s digital analytics to illustrate how these spikes in ad spend translated into increased visits to American Airlines’ website.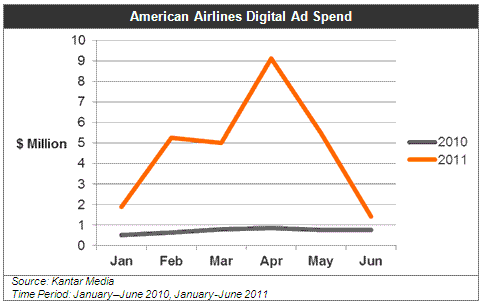
Taking into consideration seasonal travel habits that impact aa.com’s site traffic at any level, we still notice a substantial vertical shift in the site visit trend line as compared to the same period in 2010. With an average of 1.2 million more unique site visitors per month as compared to last year, American’s ad investments were successful in driving traffic to aa.com.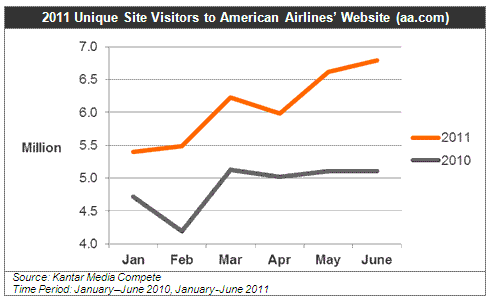
Close-up on American Airlines: Search and DisplayAmerican Airlines’ digital share of total ad budget increased from 15% to 65% between 2010 and 2011, while maintaining a nearly equal split between display and paid search.
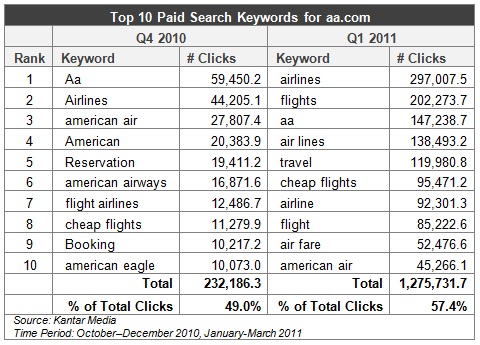
With a considerable increase in paid search advertising, we sought to determine if this change in ad investment impacted the top keywords driving traffic to the aa.com web site. To start, the number of clicks for the top ten keywords were up by 450% in Q1 2011 compared to the previous quarter. Furthermore, there was a considerable difference between the top keywords for Q4 2010 and Q1 2011, both before and after American made its official break with Orbitz and Expedia. During the former period, the American Airlines’ branded name as well as spelling and acronym variants directed the highest traffic to the aa.com website; the top four keywords were all some form of the American branded name. Generic terms like “cheap flights” and “booking” were found lower in the list and received fewer clicks. During the first quarter of 2011, however, the top two keywords that drove traffic to aa.com were the generic terms “airlines” and “flights”. We noticed that the aa.com site received most of its clicks from a general flight search; in other words, Internet search users were not initially seeking out American Airlines flights from the start of their search.
We also saw extensive changes in the list of sites carrying AA display ads between Q4 2010 and Q1 2011. The airline spent more ad dollars with new websites; in fact, the top ten websites for AA ad placements were entirely different between these two quarters. Not only were the sites different, but they were members of entirely different website categories. In Q4 2010, the highest display ad dollars were directed towards newspaper, TV station, and travel website categories. In Q1 2011, the top three site categories for AA display advertising were social networking, general interest/general entertainment, and blogs.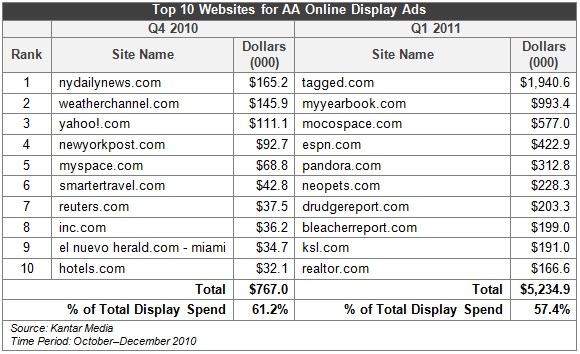
Creative Strategy
American Airlines responded to Expedia’s de-listing with ads that criticized the suspension of American flights from the online booking site. Their ads also named Orbitz, noting that American flights were no longer available on Orbitz or Expedia. More than seven different online display ads were run in February, 11 in March, and 15 in April, referencing the two travel booking sites’ limitations. After American reached an agreement with Expedia in April, the ads were suspended and they were replaced in May by two new ads that called out solely Orbitz.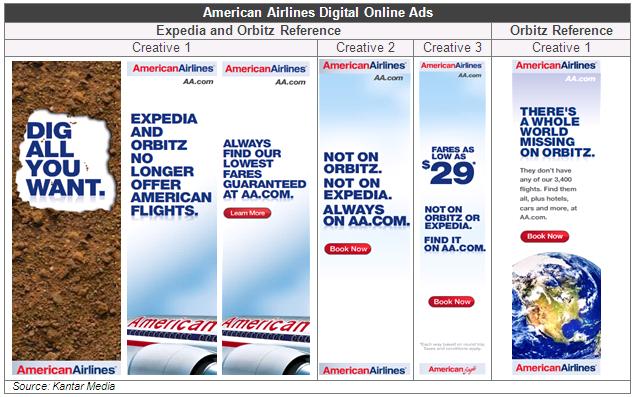
Kantar Media’s analysis of trends in the travel category and American Airlines’ digital advertising in particular is based on our monitoring of multimedia and the entire digital advertising marketplace, including display, video, ad networks and paid search. If you’d like to know more about a category that is of interest to you, please contact:About Kantar MediaEstablished in more than in 50 countries, Kantar Media enables exploration of multimedia momentum through analysis of print, radio, TV, Internet, social media, and outdoors worldwide. Kantar Media offers a full range of media insights and audience measurement services through its global business sectors – Intelligence, Audiences and TGI & Custom. Combining the deepest expertise in the industry, Kantar Media tracks more than 3 million brands and delivers insights to more than 22,000 customers around the world.-
Latest Press
Pappachen Named EVP of Strategy and Business Development for Kantar Media’s...
To head Global Ad Expenditure operations New York, NY August 15, 2013 – Kantar Media, the leading...
-
In The News
The analysts at Kantar Media recently pulled together a pile of data on what the last decade of championship football has looked like on America's TVs. - Harvard Business Review
-
Contact Us
Follow us across the Web for a regular stream of insights, news and analysis.
-