

 print
print New York, NY, June 13, 2011 – Total advertising expenditures in the first quarter of 2011 increased 4.4 percent from a year ago and finished the period at $32.5 billion, according to data released today by Kantar Media, a leading provider of media research and insights. Although first quarter performance fell below 2010 levels, the ad market has now achieved five consecutive quarters of year-over-year growth.
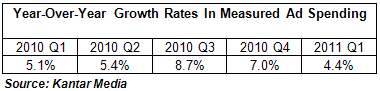
“With the advertising recovery in its second year, 2011 gets benchmarked against the elevated spending levels of last year and that makes for tougher comparisons,” said Jon Swallen, SVP Research Kantar Media Intelligence NA. “Despite slowing growth, there are positive signs. The market expanded by $1.4 billion during the first quarter which nearly equals the amount of gain at the start of 2010 when the recovery began. In addition, a rising proportion of advertisers are increasing their ad budgets and this indicates spending growth is still rippling outward through the market.”
Measured Ad Spending By Media
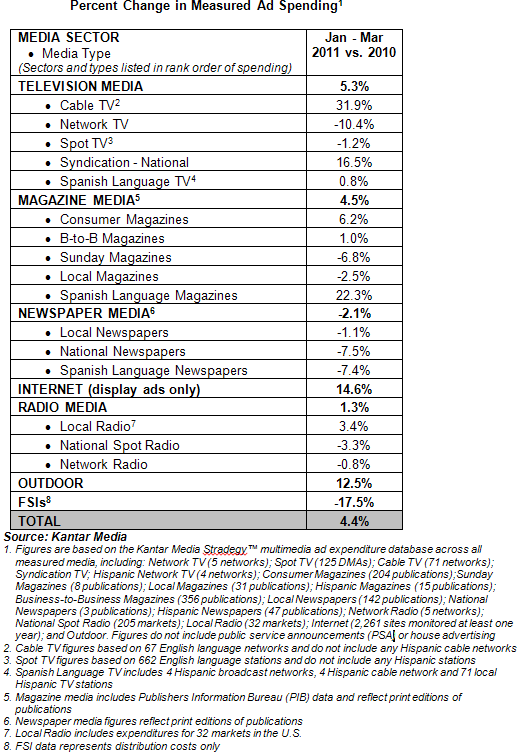
Within the television sector, sports programming drove a sizable shift of ad dollars from broadcast networks to cable networks. Cable TV expenditures surged 31.9 percent, propelled by the expansion of NCAA Men’s Basketball Tournament coverage onto Turner networks and a consolidation of major college football bowl games at ESPN. Network TV ad spending declined 10.4 percent due to the absence of Winter Olympics and college bowl games.
Syndication TV expenditures advanced 16.5 percent, reflecting more hours of monitored programming and larger allocations from consumer packaged goods marketers. Spot TV, with its biennial business cycle tied to Olympics and political advertising in even-numbered years, saw ad spending fall by 1.2 percent.
Internet display expenditures increased 14.6 percent in the first quarter, benefitting from strong demand by automotive, media and travel advertisers. Outdoor (+12.5 percent) was paced by healthy increases from the local service, education and financial service categories.
Among magazine media, Consumer Magazines continued the revival that started in mid-2010 and expenditures rose 6.2 percent in the period. While a majority of monitored publications posted increases, one of the strongest segments from top to bottom was the diverse group of sports-related enthusiast titles. Spanish Language Magazines (+22.3 percent) and B-to-B publications (+1.0 percent) also registered gains.
The pace of spending in Radio media softened a bit during the first three months. Local Radio was up 3.4 percent as higher budgets from auto dealers and insurance marketers offset weaker activity from local retailers, telecom and restaurants. National Spot Radio (-3.3 percent) lagged in comparison to a stellar year-ago period when ad spending grew by double digits.
Newspaper media continued to trail the overall market. Despite resurgent spending from auto dealers, Local Newspapers fell by 1.1 percent versus a year ago and the segment has now declined for 22 consecutive quarters. National Newspapers (-7.5 percent) and Spanish Language Newspapers (-7.4 percent) also deteriorated.
Measured Ad Spending By Advertiser
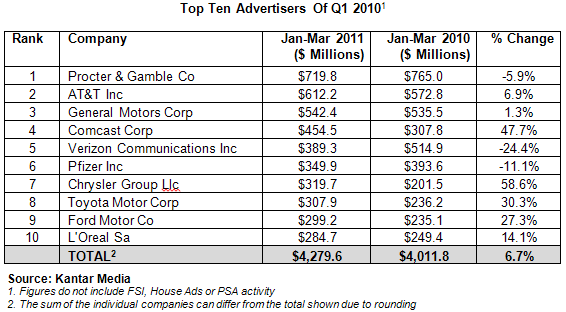
Spending among the ten largest advertisers in the opening quarter of 2011 was $4,279.6 million, a 6.7 percent increase compared to a year ago. Among the Top 100 marketers, a diversified group accounting for close to one-half of all measured ad expenditures, budgets climbed 4.8 percent.
Procter & Gamble maintained its familiar top-ranked position with spending of $719.8 million, down 5.9 percent. The company trimmed spending for its portfolios of OTC remedies and household cleaning products and redirected the money towards personal hygiene and hair care brand lines.
Four automotive advertisers landed in the Top Ten, the first time this has occurred since Q1 2004. Chrysler Group boosted ad budgets by 58.6 percent to $319.7 million. Toyota Motor spent $307.9 million, an increase of 30.3 percent. Ford Motor weighed in with $299.2 million, up 27.3 percent. Only General Motors was in single digit growth territory, up 1.3 percent to $542.4 million.
Ad expenditures for the two largest telecom marketers continued to move in opposite directions. AT&T hiked spending by 6.9 percent to $612.2 million while rival Verizon Communications slashed its outlays by 24.4 percent to $389.3 million.
Comcast cracked the Top 10 by virtue of completing the NBC Universal acquisition and folding that division’s hefty movie ad budgets into its corporate totals. On a like-for-like basis, Comcast expenditures jumped 47.7 percent to $454.5 million.
Measured Ad Spending By Category
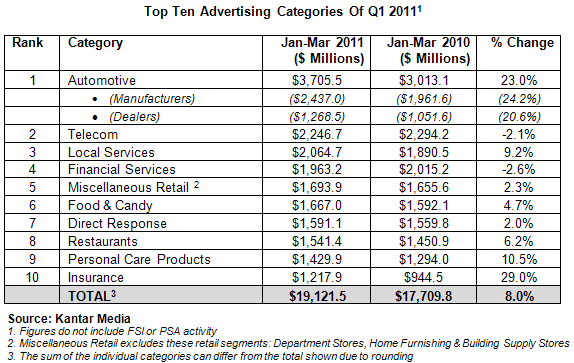
Expenditures for the ten largest categories grew 8.0 percent in the first quarter to $19.12 billion.
Automotive was the top category with $3,705.5 million of spending, up 23.0 percent. Manufacturers and dealers contributed equally to the improvement. Ad expenditure growth was in line with the 20.1 percent increase in new vehicle sales during the period. This indicates that average ad spend per vehicle was roughly flat, continuing a five year trend that covers several extremely different business climates.
The Insurance category posted the highest rate of growth among the Top Ten, a 29.0 percent increase to $1,217.9 million. The fierce competition among auto insurers was punctuated by the rollout of several new and highly visible campaigns from category leaders which swelled spending amounts.
For packaged goods marketers, the ongoing potential for budget-conscious consumers to trade down to lower priced brands has stimulated ad spending on both sides of the divide. Expenditures for Food & Candy were up 4.7 percent to $1,667.0 million and Personal Care Products increased by 10.5 percent to $1,429.9 million. The Restaurants category, another sector that is sensitive to changes in discretionary consumer spending, spent $1,541.4 million in the period, an increase of 6.2 percent.
Only two of the leading categories had declines. Telecom was off 2.1 percent to $2,246.7 million as reductions by satellite and cable TV service providers dragged down results. Financial Services dipped 2.6 percent to $1,963.2 million. Aggressive spending from credit card marketers was offset by large cutbacks for financial investment products.
Top Spending Advertisers Within Select Media
The top ten TV advertisers spent $2,913.6 million in the medium during the first quarter, up 5.7 percent from a year ago. This group accounted for 16.9 percent of total TV expenditures by all advertisers.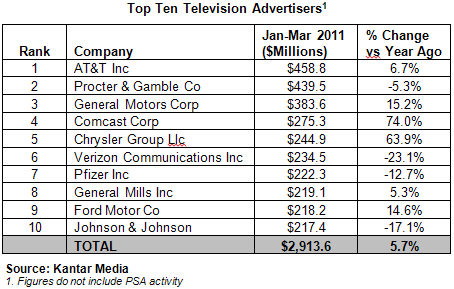
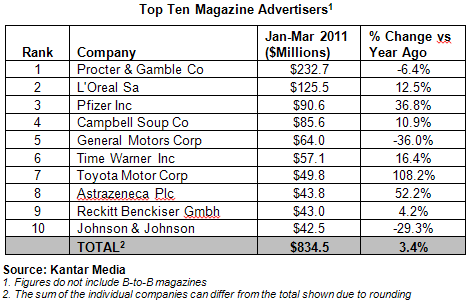
The ten largest magazine advertisers invested a total of $834.5 million in the medium, up 3.4 percent. They accounted for a 17.5 percent share of all magazine ad dollars. CPG marketers claimed five of the ten spots on this list.
The top ten internet display advertisers of Q1 2011 invested $524.5 million in the medium, an increase of 33.2 percent. As a proportion of total display ad spending by all advertisers, the top ten accounted for 19.7 percent, a larger concentration than either TV or magazines. Auto manufacturers were represented in the ranking with three spots and some of the most dramatic growth rates. Telecom and financial service companies also claimed multiple spots.
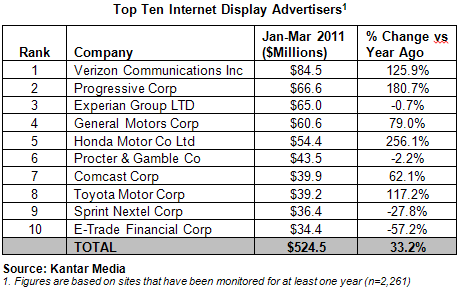
Comparing the three lists, only Procter & Gamble and General Motors are present on each one.
About Kantar Media
Established in more than in 50 countries, Kantar Media enables exploration of multimedia momentum through analysis of print, radio, TV, internet, social media, and outdoors worldwide. Kantar Media offers a full range of media insights and audience measurement services through its global business sectors – Intelligence, Audiences and TGI & Custom. Combining the deepest expertise in the industry, Kantar Media tracks more than 3 million brands and delivers insights to more than 22,000 customers around the world.